

Problem
Visudat addresses the challenge of making sense of complex and voluminous data. Many individuals and organizations struggle to interpret raw data and derive actionable insights from it. Traditional methods of data analysis can be time-consuming, require specialized skills, and often fail to present information in a clear and engaging manner. The problem of needing a data expert arises from the complexity and technical knowledge required to effectively analyze and interpret data. Many organizations and individuals struggle to derive valuable insights from their data because they lack the specialized skills needed to handle large datasets, define meaningful metrics, and create accurate visualizations. This expertise typically involves understanding statistical methods, data modeling, and data visualization techniques, which can be daunting for those without a background in data science. As a result, businesses often find themselves dependent on data experts to set up and maintain analytical tools and generate reports. This dependency can lead to delays, increased costs, and inefficiencies, especially in environments where quick, data-driven decisions are critical. Additionally, the shortage of skilled data professionals can further exacerbate these challenges, making it difficult for organizations to fully leverage their data for strategic advantage.
Solution
Visudat addresses the challenge of transforming complex data into actionable insights without requiring advanced technical skills. Many individuals and organizations face difficulties in defining and tracking key performance indicators (KPIs) and understanding large datasets. Traditional data analysis tools often require specialized expertise to set up and interpret metrics, making it hard to derive meaningful insights quickly. Visudat simplifies this process by allowing users to easily define datasets, including metrics and calculated KPI values, through straightforward mathematical expressions. This feature eliminates the need for a data expert, enabling users from all backgrounds to craft insightful dashboards. The platform visualizes these KPIs on dynamic and interactive dashboards, helping users to quickly identify trends, measure performance, and make data-driven decisions. By making KPI definition and visualization accessible and intuitive, Visudat empowers users to unlock the full potential of their data. A solution for dashboard sharing and collaboration involves providing a platform that allows users to easily share and work together on dashboards in real-time. It includes features like access control and permissions, real-time collaboration tools, and integration with communication platforms.
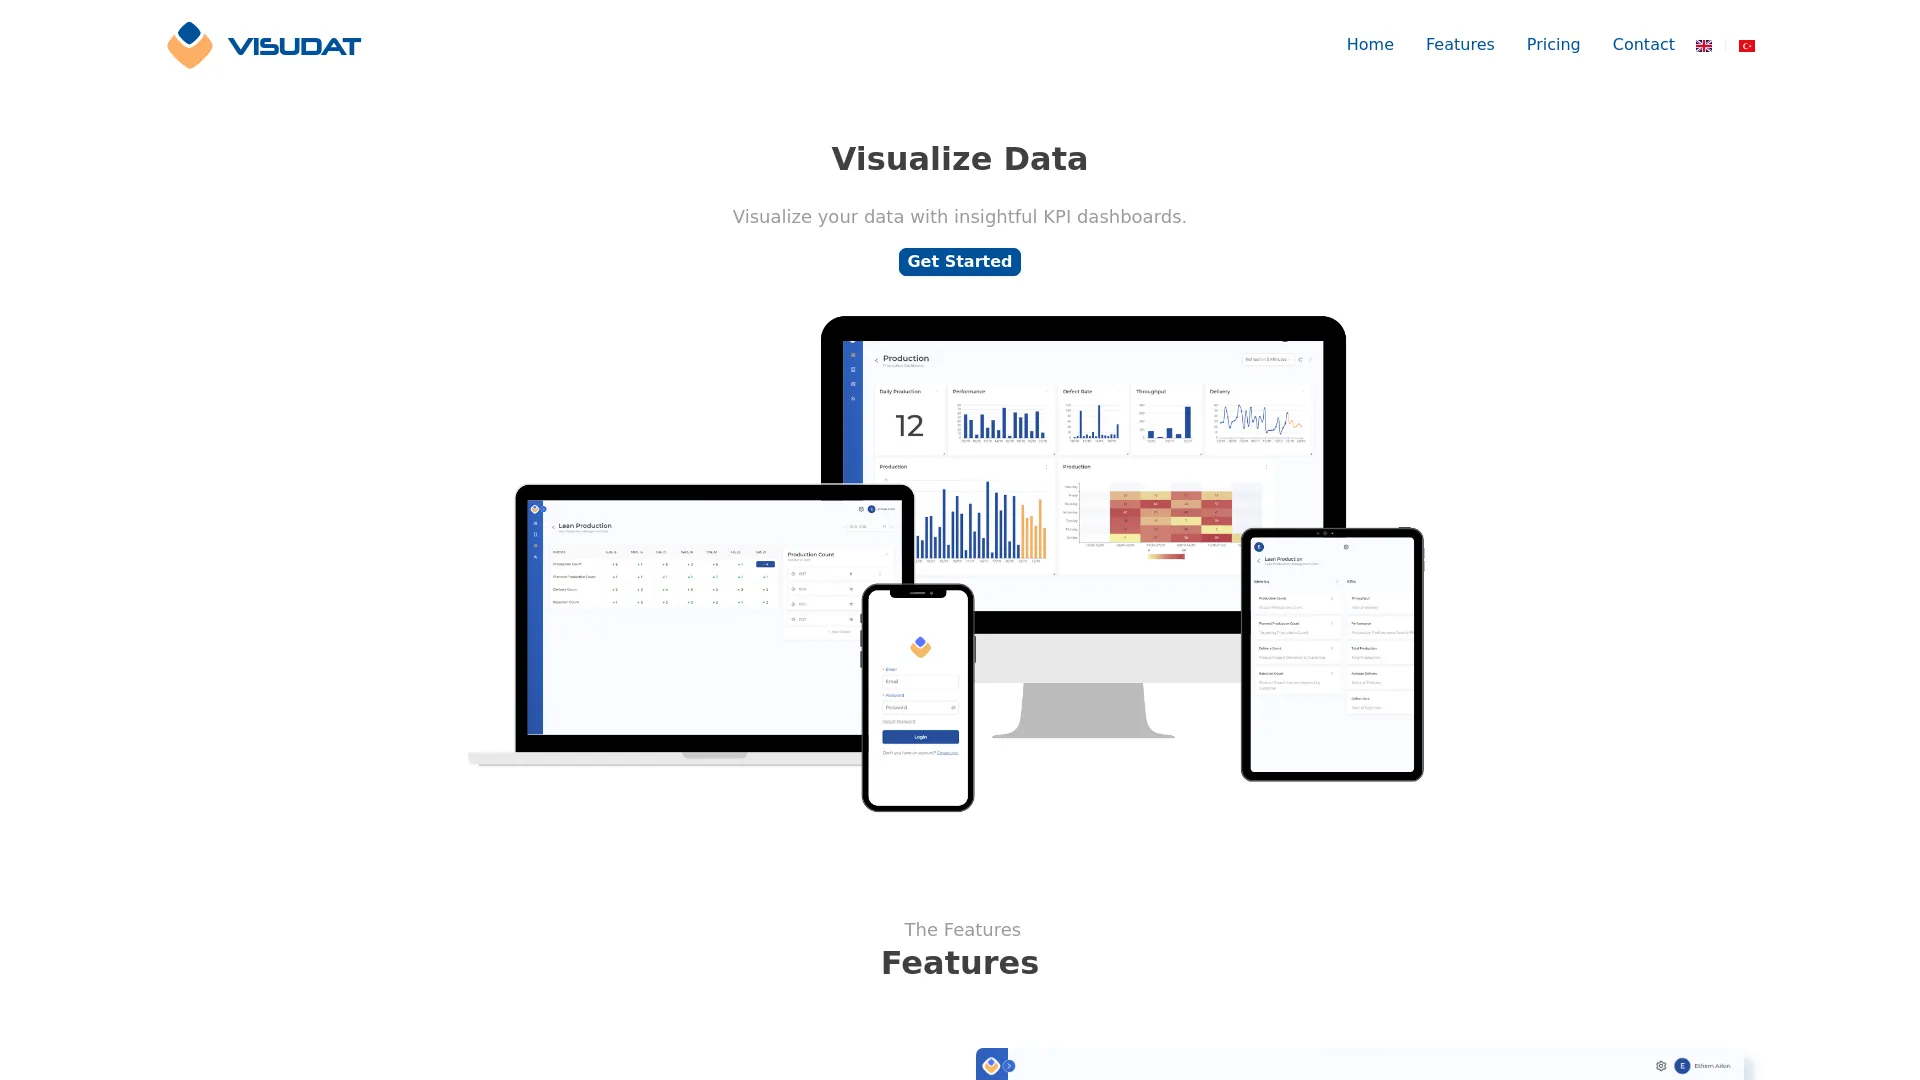
Product page snapshot
Want to connect with Visudat?
Sign up on StartupDeal to see the full profile, compare startups with AI and reach the team.